IR Spectroscopy: Definition, Instrumentation, Working and Applications
What is IR Spectroscopy?
Infrared spectroscopy is absorption spectroscopy that deals with the recording of the absorption of the electromagnetic radiations of the infrared region of the electromagnetic spectrum. The IR region ranges from 700-1000 nm.
This technique is widely used for the detecting of functional groups, characterization of proteins, analysis of various liquids, and identification of molecules and their composition.
Instrumentation of IR spectroscopy
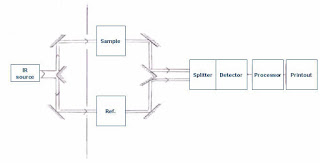
1. Radiation source
The radiation source should emit IR electromagnetic radiations which are steady, intense, and extended over the desired wavelength. That's why radiation sources like Nernst glower, globar source, incandescent lamp, and mercury arc lamp.
2. Monochromator
It helps to select desired frequencies of IR radiations because our sample will only absorb some specific frequencies of IR radiations. Prism and grating are the most commonly used monochromators.
3. Sample cells and sampling
IR spectroscopy is used for the characterization of different samples like solid, liquid, and gas. The sampling of different phases should be done in a material that is transparent to IR radiation.
(a) Sampling of solids
Solids can be run in solution, mull techniques, and pressed pellet techniques.
(b) Sampling of liquids
Samples that are liquid at room temperature are put in rectangular cells made up of NaCl, KBr, etc.
(c) Sampling of gases
A sampling of gases is done similarly to liquids and the cell should be made up of KBr or NaCl. The gas must not react with the cell windows or the reflecting surfaces and moisture must be avoided.
4. Detector
Detector helps to detect the transmitted IR radiation by the sample. The detector should be placed and designed in such a way that it can detect even a low-frequency signal. For that reason, thermal detectors are widely used in IR spectrometry. Following other detectors are also used like
1. Bolometers
2. Thermocouple
3. Thermistors
4. Golay cell
5. Photoconducting cell
6. Semiconductivity cell
7. Pyroelectric detectors
8. Fourier Transfor systems
Working of IR-spectrophotometer
We know that compounds that contain functional groups having single and double bonds always stay in a state of vibration motion. This is called stretching and wagging. They absorb only a specific frequency of IR radiation and the rest unwanted frequencies get transmitted from the compound without any absorption. That transmitted radiation is detected by the detector and a graph is plotted.
For Example: Let's say we have a molecule that has stretching and wagging at 2Hz and 4Hz respectively. If the radiation falls on the sample suppose has a 1Hz frequency. The sample will transmit 100 % radiation without any absorption as no stretching and wagging take place at this frequency.
Now, if the IR radiation of frequency 2Hz falls on the sample then it coincides with the stretching frequency (2Hz) of the molecule and the radiation will be absorbed by the sample and there will be a sharp drop in the value of transmittance and it will be indicated in the graph too.
Now, further 3Hz frequency IR radiations fall on the sample and again it will show 100 % transmittance as no group in the sample stretch or wags at 3Hz frequency. Now, the radiation proceeds to 4Hz then again there will be a sharp drop in the transmittance as it coincides with the 4Hz wagging frequency of the compound. This process goes on till we get our final graph.
It is noted that the graph obtained from the IR spectroscopy will contain two regions that are functional group/absorption region and the fingerprint region. The functional group region helps us to identify the functional groups whereas the fingerprint region not only helps us to identify functional groups but also other small groups associated with the compound.
Application of IR spectroscopy
1. Identification of organic compounds
The IR spectroscopy helps us to identify the different organic compounds as it is a highly characteristic property. Identification of substances like hydrocarbons like alkenes, cycloalkanes, and aromatic hydrocarbons is done by IR spectroscopy.
2. Determination of the molecular structure
Prediction of the molecular structure of the unknown samples can be done using IR spectroscopy. It is done by assessment of the positions of absorption bands in the electromagnetic spectrum.
3. Studying the progress of reactions
Progress of a chemical reaction can be readily followed by examining spectra of small portions of the reaction mixture withdrawn from time to time.
4. Detection of impurities in compound
It is likely to determine whether a given sample of a compound is pure or not provided the reference spectrum of the pure compound is available.
5. Isomerism in organic chemistry
IR spectra are useful for identifying isomers. This distinction between isomers may not be possible by chemical methods.
Now let us discuss about FTIR Spectroscopy.
FTIR Spectroscopy
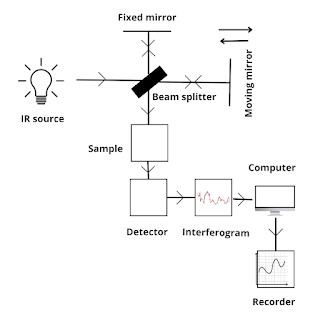
FT-IR spectroscopy is a modified form of IR spectroscopy, it uses a complex mathematical equation known as Fourier transformation to plot a graph. All other principle remains the same that is it depends upon the vibration of molecules where each functional group has its vibrational energy that can be used to identify a molecule.
Working
The final graph obtained from the FT-IR spectroscopy will contain peaks having a constructive peak and destructive peak.
Advantages of FT-IR spectroscopy over IR spectroscopy
1. In FT-IR spectroscopy, there is only one moving mirror involved that is mounted on a frictionless air bearing. Thus, dispersion or filtering is not required and traditional energy-wasting slits are not required.
2. It uses of Fourier-Transformation mathematical equation to produce the final graph. Thus, it is more accurate and presentable than traditional IR spectroscopy.
3. The data obtained through FT-IR spectrometer can be stored in 3rd memory which can be used to produce a graph at any time as per the convenience of the user.
4. It provides better resolution than IR spectroscopy.


